How to Read and Use Histograms in Photography
Published 16 September 2026 by MPB
A histogram is a graph that displays the tones in your photo and it’s one of the most useful tools you have for judging exposure accurately. Rather than relying on how bright an image looks on your camera’s screen or electronic viewfinder (EVF), which can be misleading depending on screen brightness and your surroundings, the histogram will give you a more precise reading.
While it’s rarely 100% accurate, a histogram is still a far more objective indication of where the light and dark tones in your photo actually sit. If you want to get the most detail out of every shot and consistently achieve the best possible exposure, learning how the histogram works is essential.
MPB photographer Connor Redmond, who has been shooting both professionally and creatively for over X years, uses histograms all the time in his work. He’ll walk you through what histograms are and why they are super useful for improving your exposure skills and getting the most out of every shot.
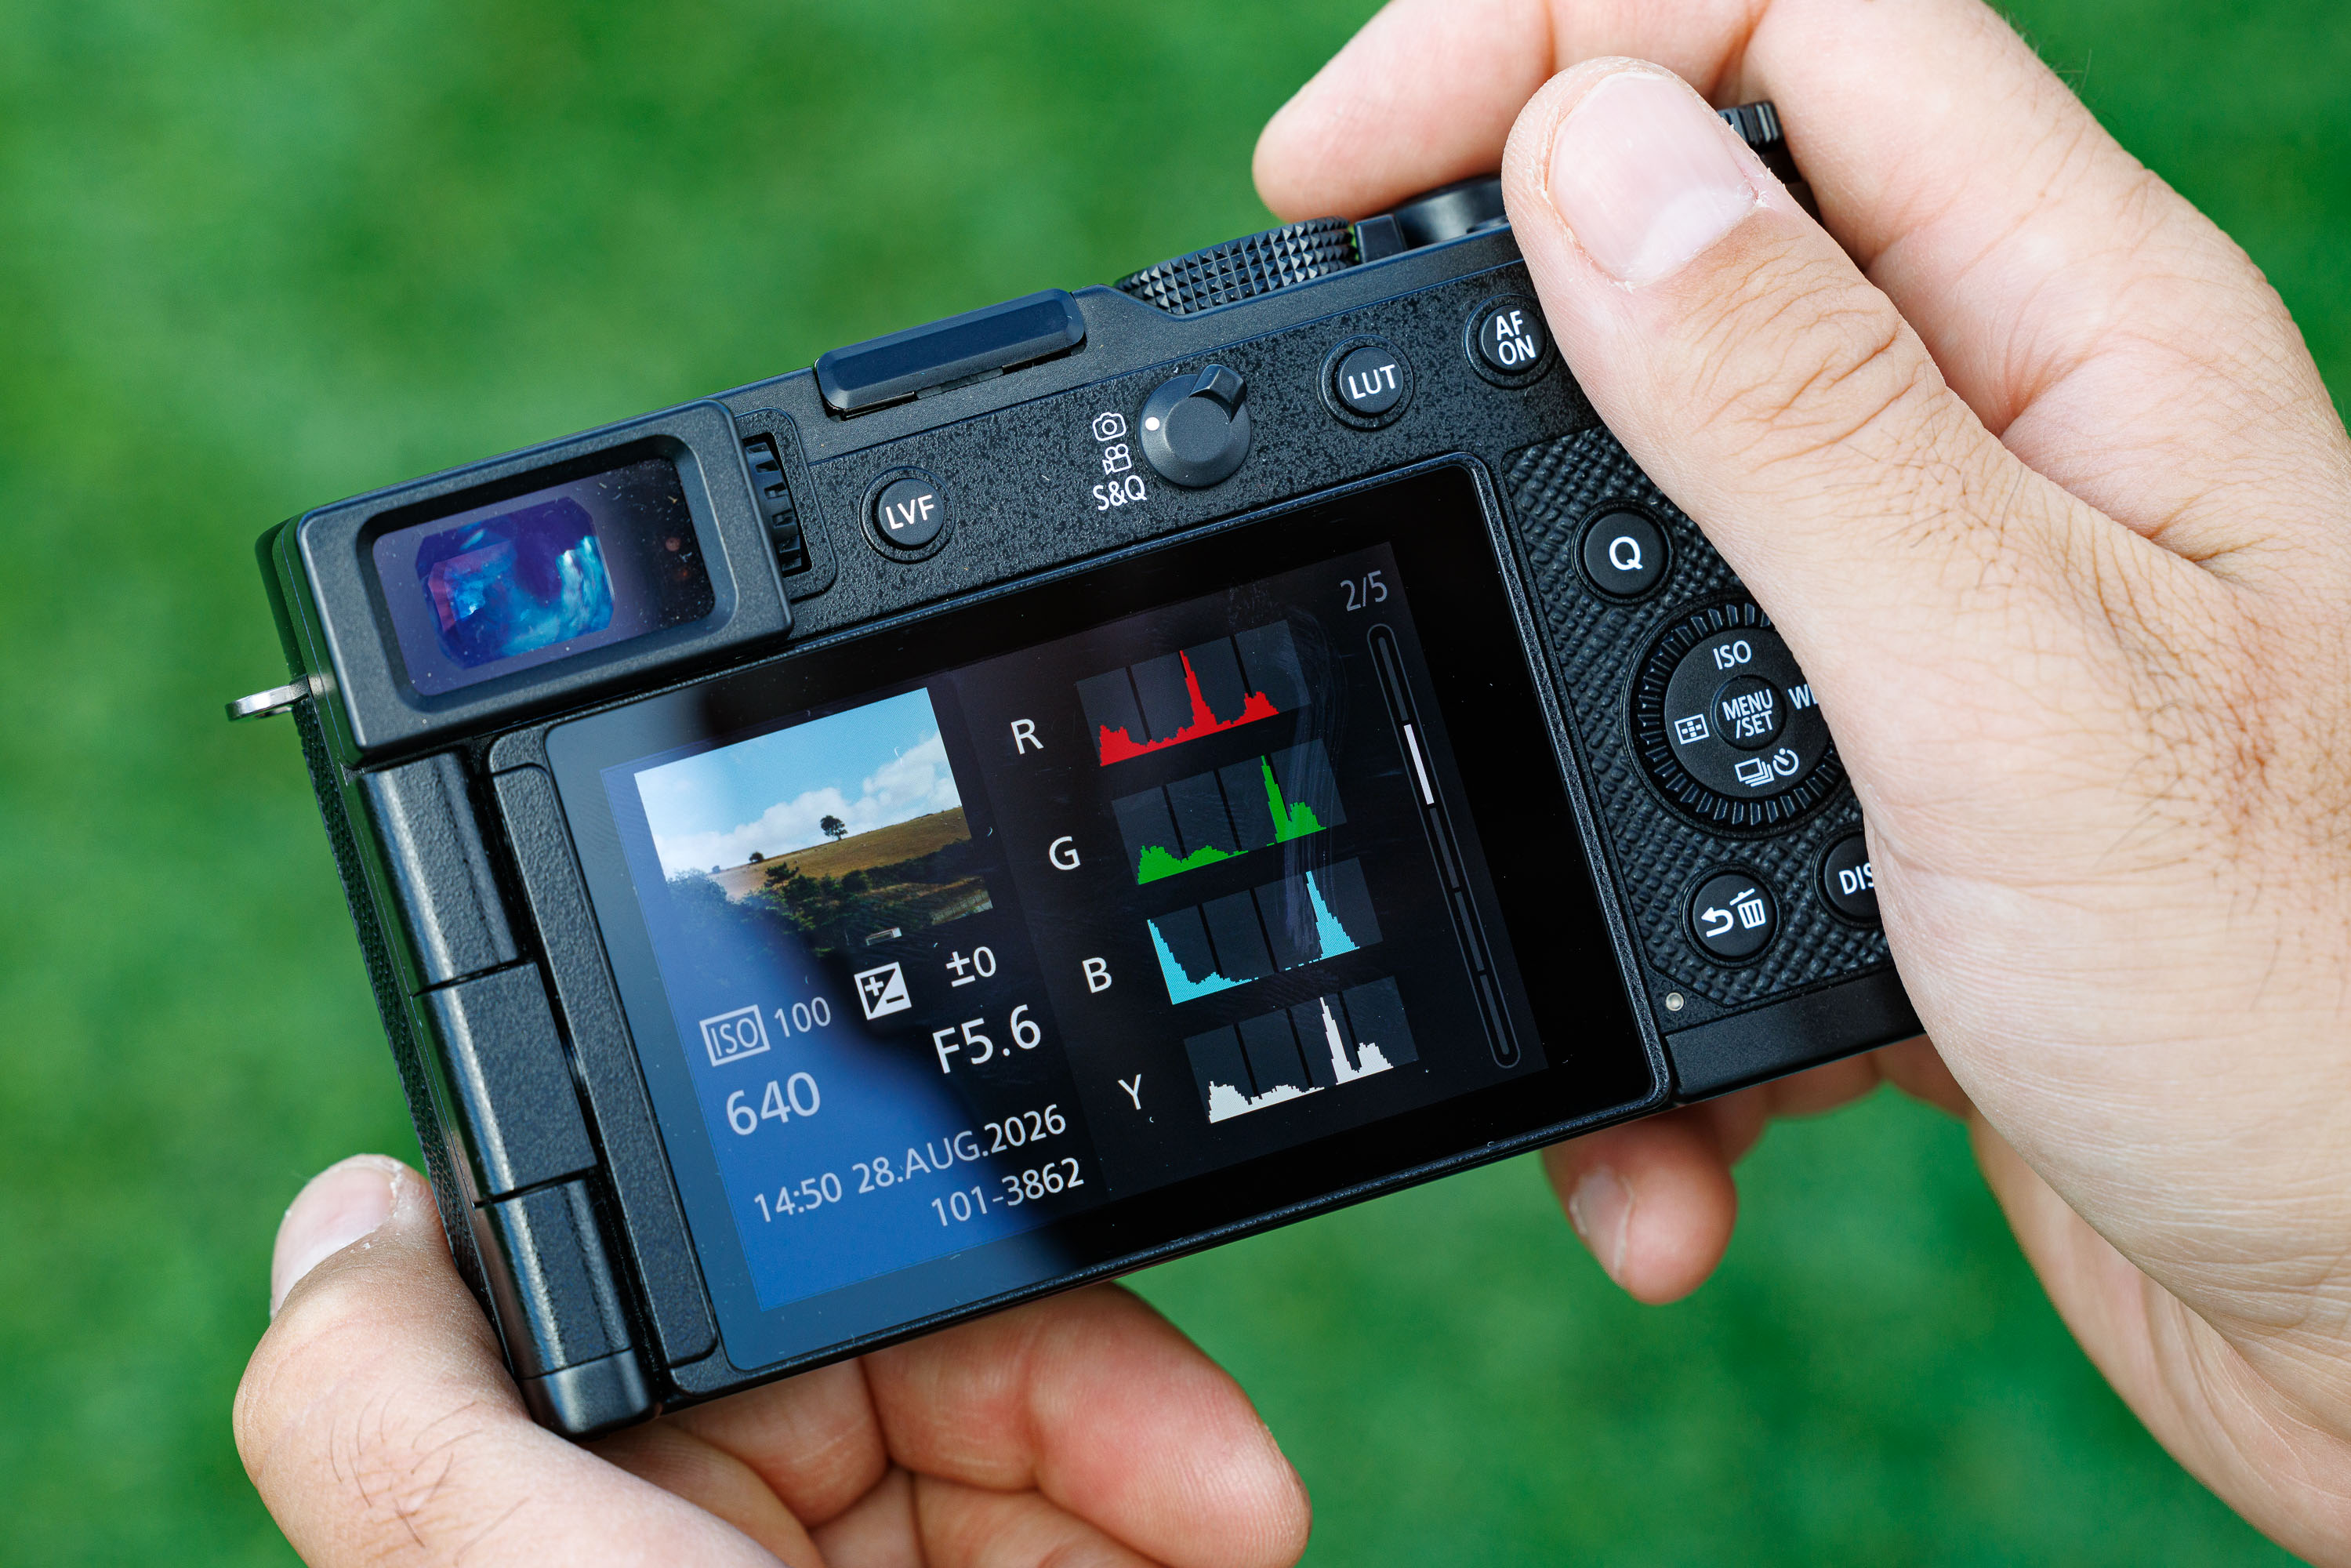
Most cameras can show you the histograms for every photo you take.
What is a histogram in photography?
A histogram shows the lightness of every pixel in your images as a graph, like the one below. Starting from the left of the graph, we have the deepest blacks and shadows. In the middle are your midtones and on the left are your highlights.
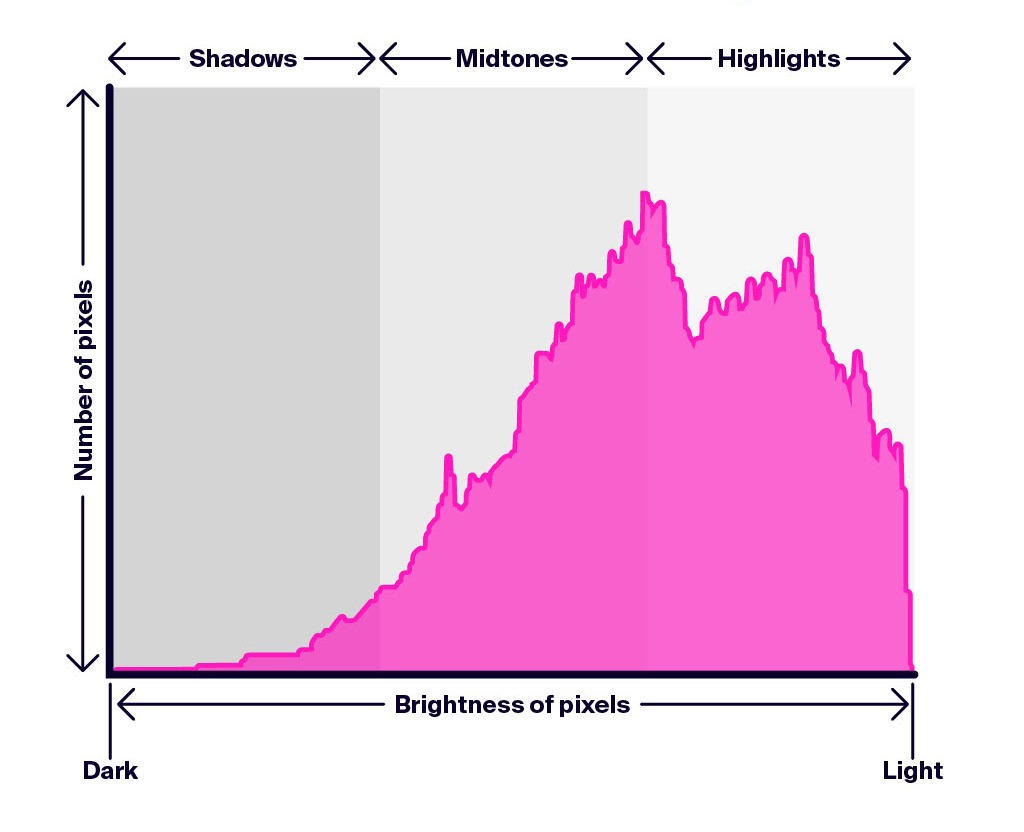
Technical note: If you see numbers on your histogram, 0 represents pure black and 255 represents pure white. If a pixel has one of these two values, it has no information at all. The reason the scale is 0 to 255 is that 99% of camera histograms use JPEGs, which use 8-bit depth, so there are 256 possible combinations. Computers start counting from 0, which is why the range starts there.
How to view a histogram on your camera
Virtually all modern cameras allow you to view a histogram in-camera. Some allow you to see one live as you compose your shot, but older cameras often only let you view the histogram after you take the picture.
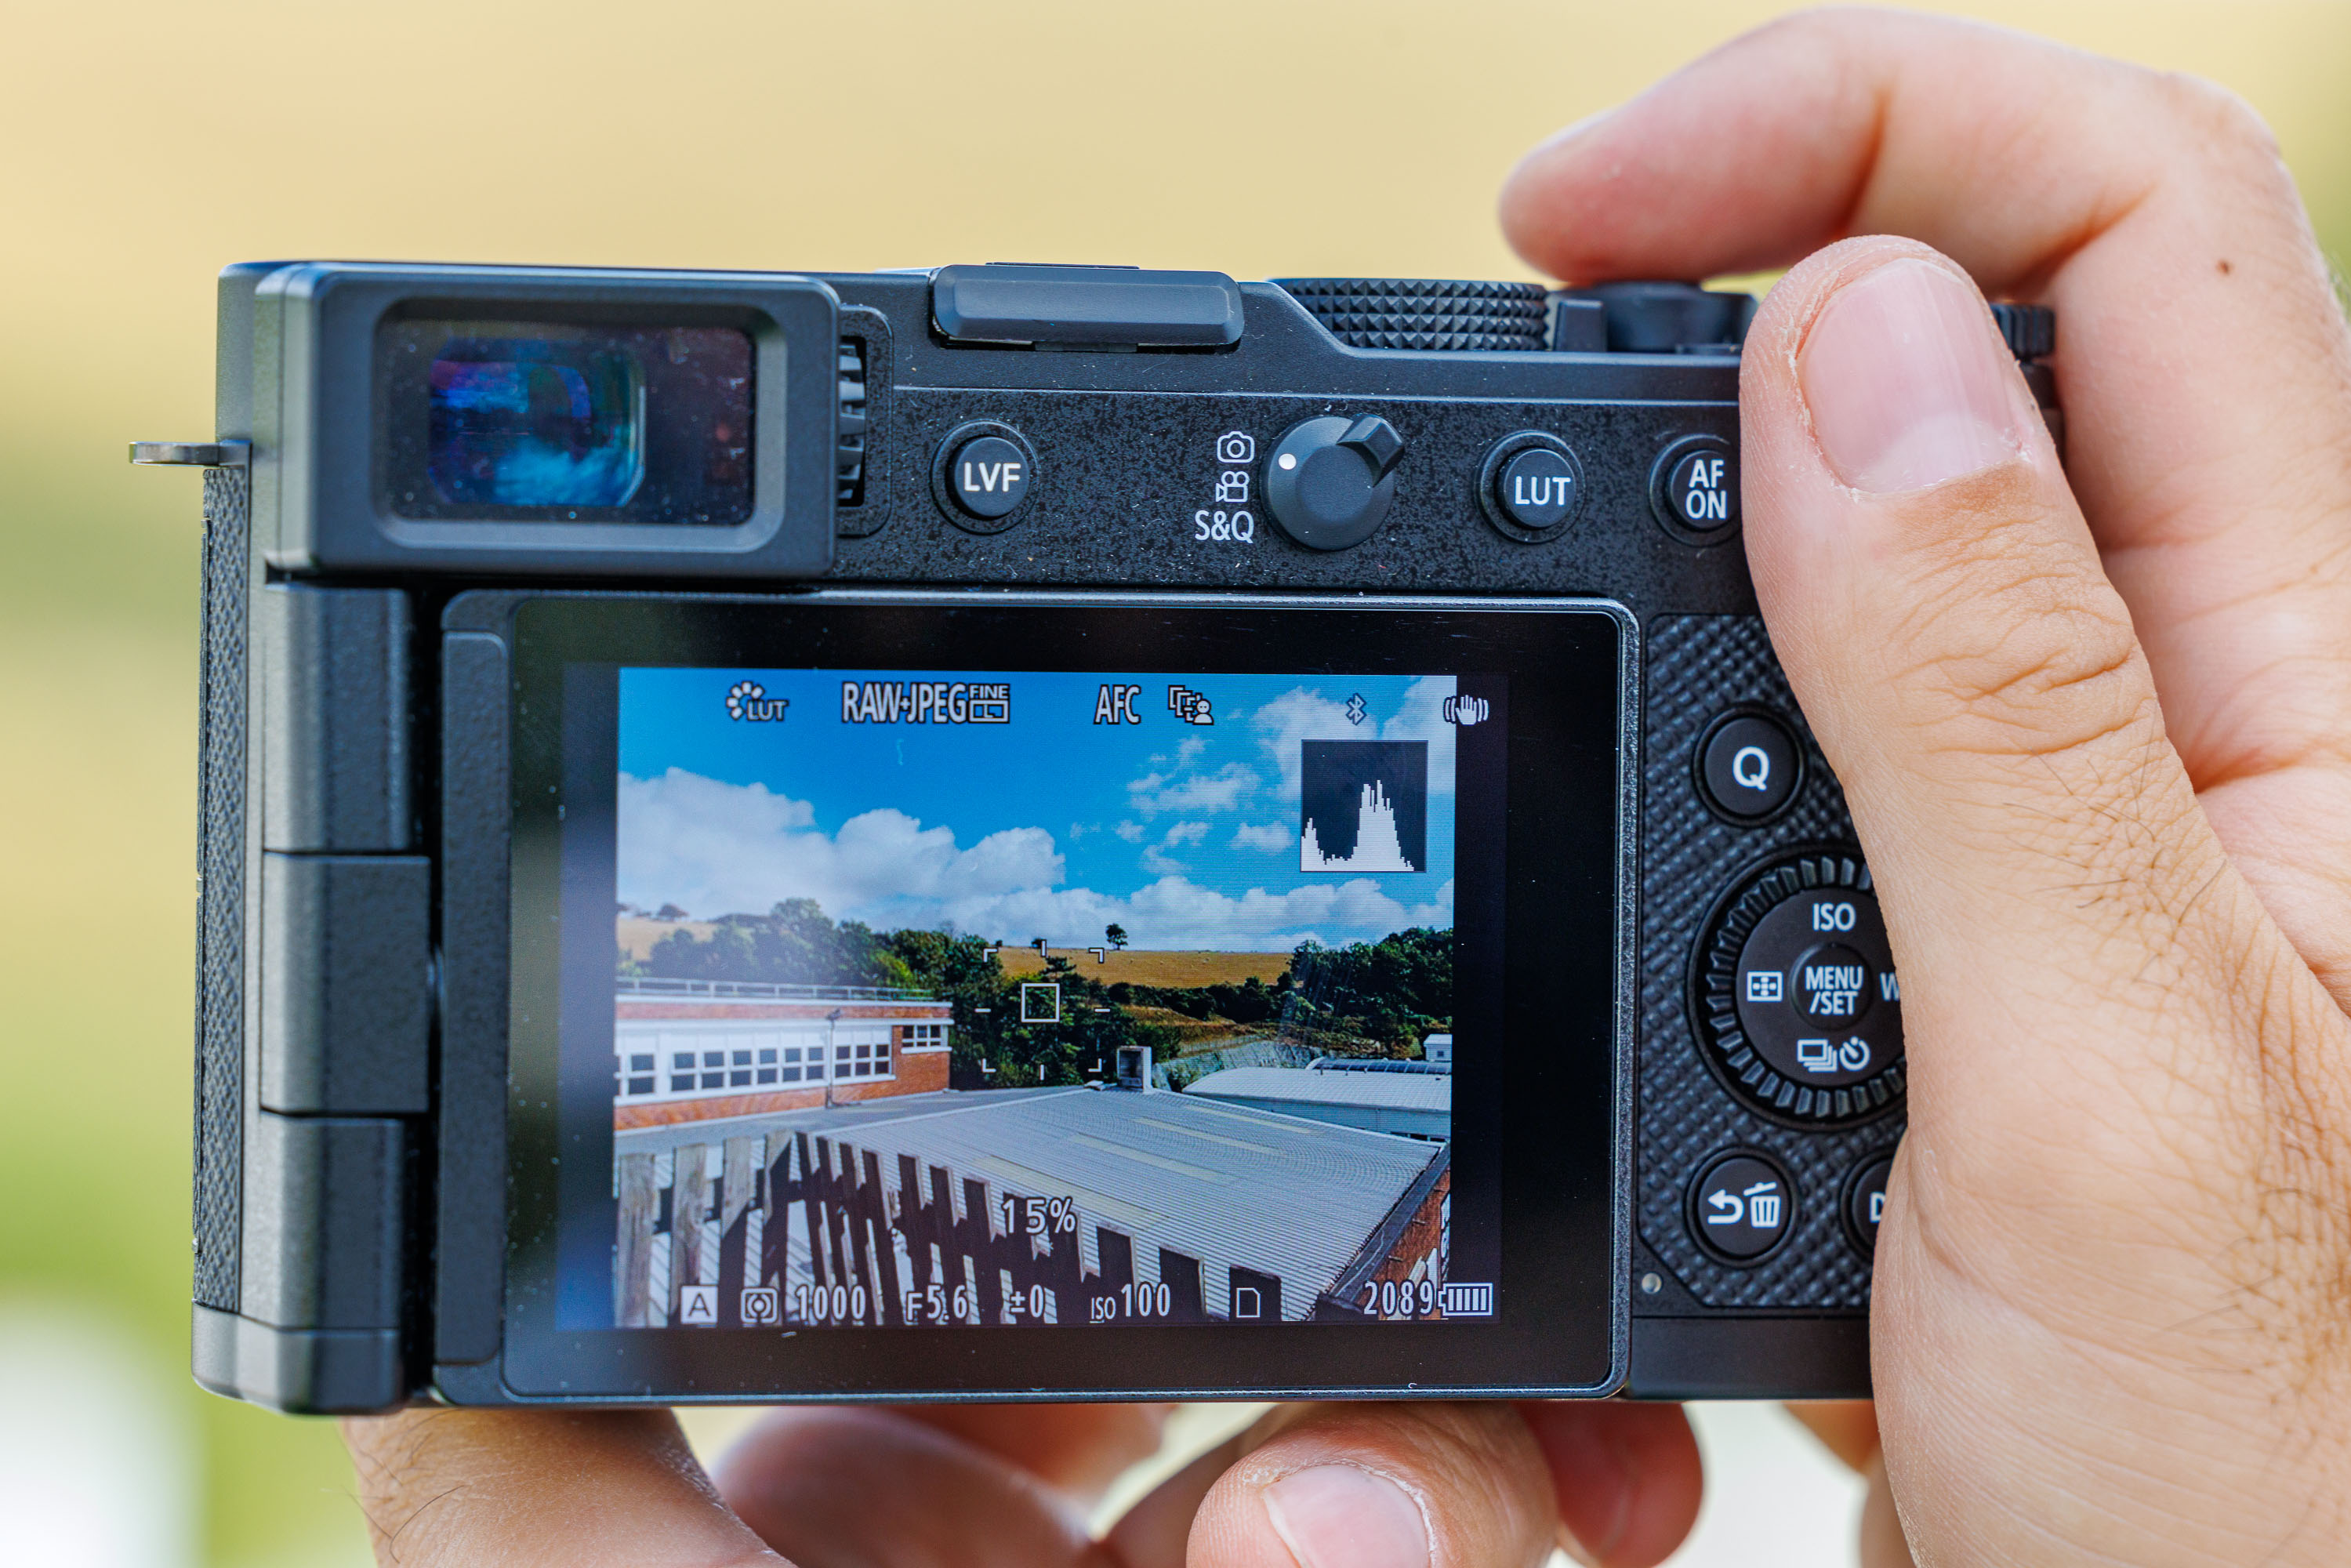
Most cameras will allow you to view a live histogram as you shoot.
Either way, it’s worth finding out how to enable your camera’s histogram so you get into the habit of checking it. The histogram is a far more reliable guide than judging brightness by eye on the screen and it only takes a second once you’re used to reading it.
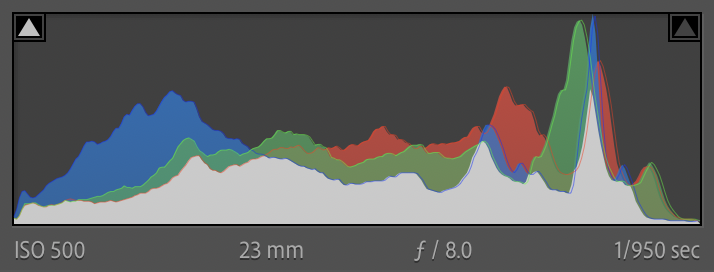
The histogram in Lightroom Classic
If you edit your photos, most editing software (Lightroom, Photoshop, Capture One, etc.) will also display a histogram, so the habit carries over nicely into post-production too.
Understanding ‘clipping’
The screenshot below from Lightroom Classic shows what photographers call clipping. In Lightroom, you'll see that any pure white pixels are clipping, or "blown out". There is no recoverable information there. That is what ‘clippin’ refers to.
If the graph is bunched up against the left edge, your shadows are “crushed”, meaning there's no usable information left in them. If it’s pushed against the right edge, your highlights are “blown out” or pure white, and they’ll have exactly the same problem.
In the histogram in the top-right corner, you’ll also see that most of the pixels are bunched up in the highlights, which makes sense, as this scene was on a Scottish mountain with snow and the sky was both very bright and very white.
The goal is to keep your tonal information within the graph's edges wherever you can, to avoid both extremes.
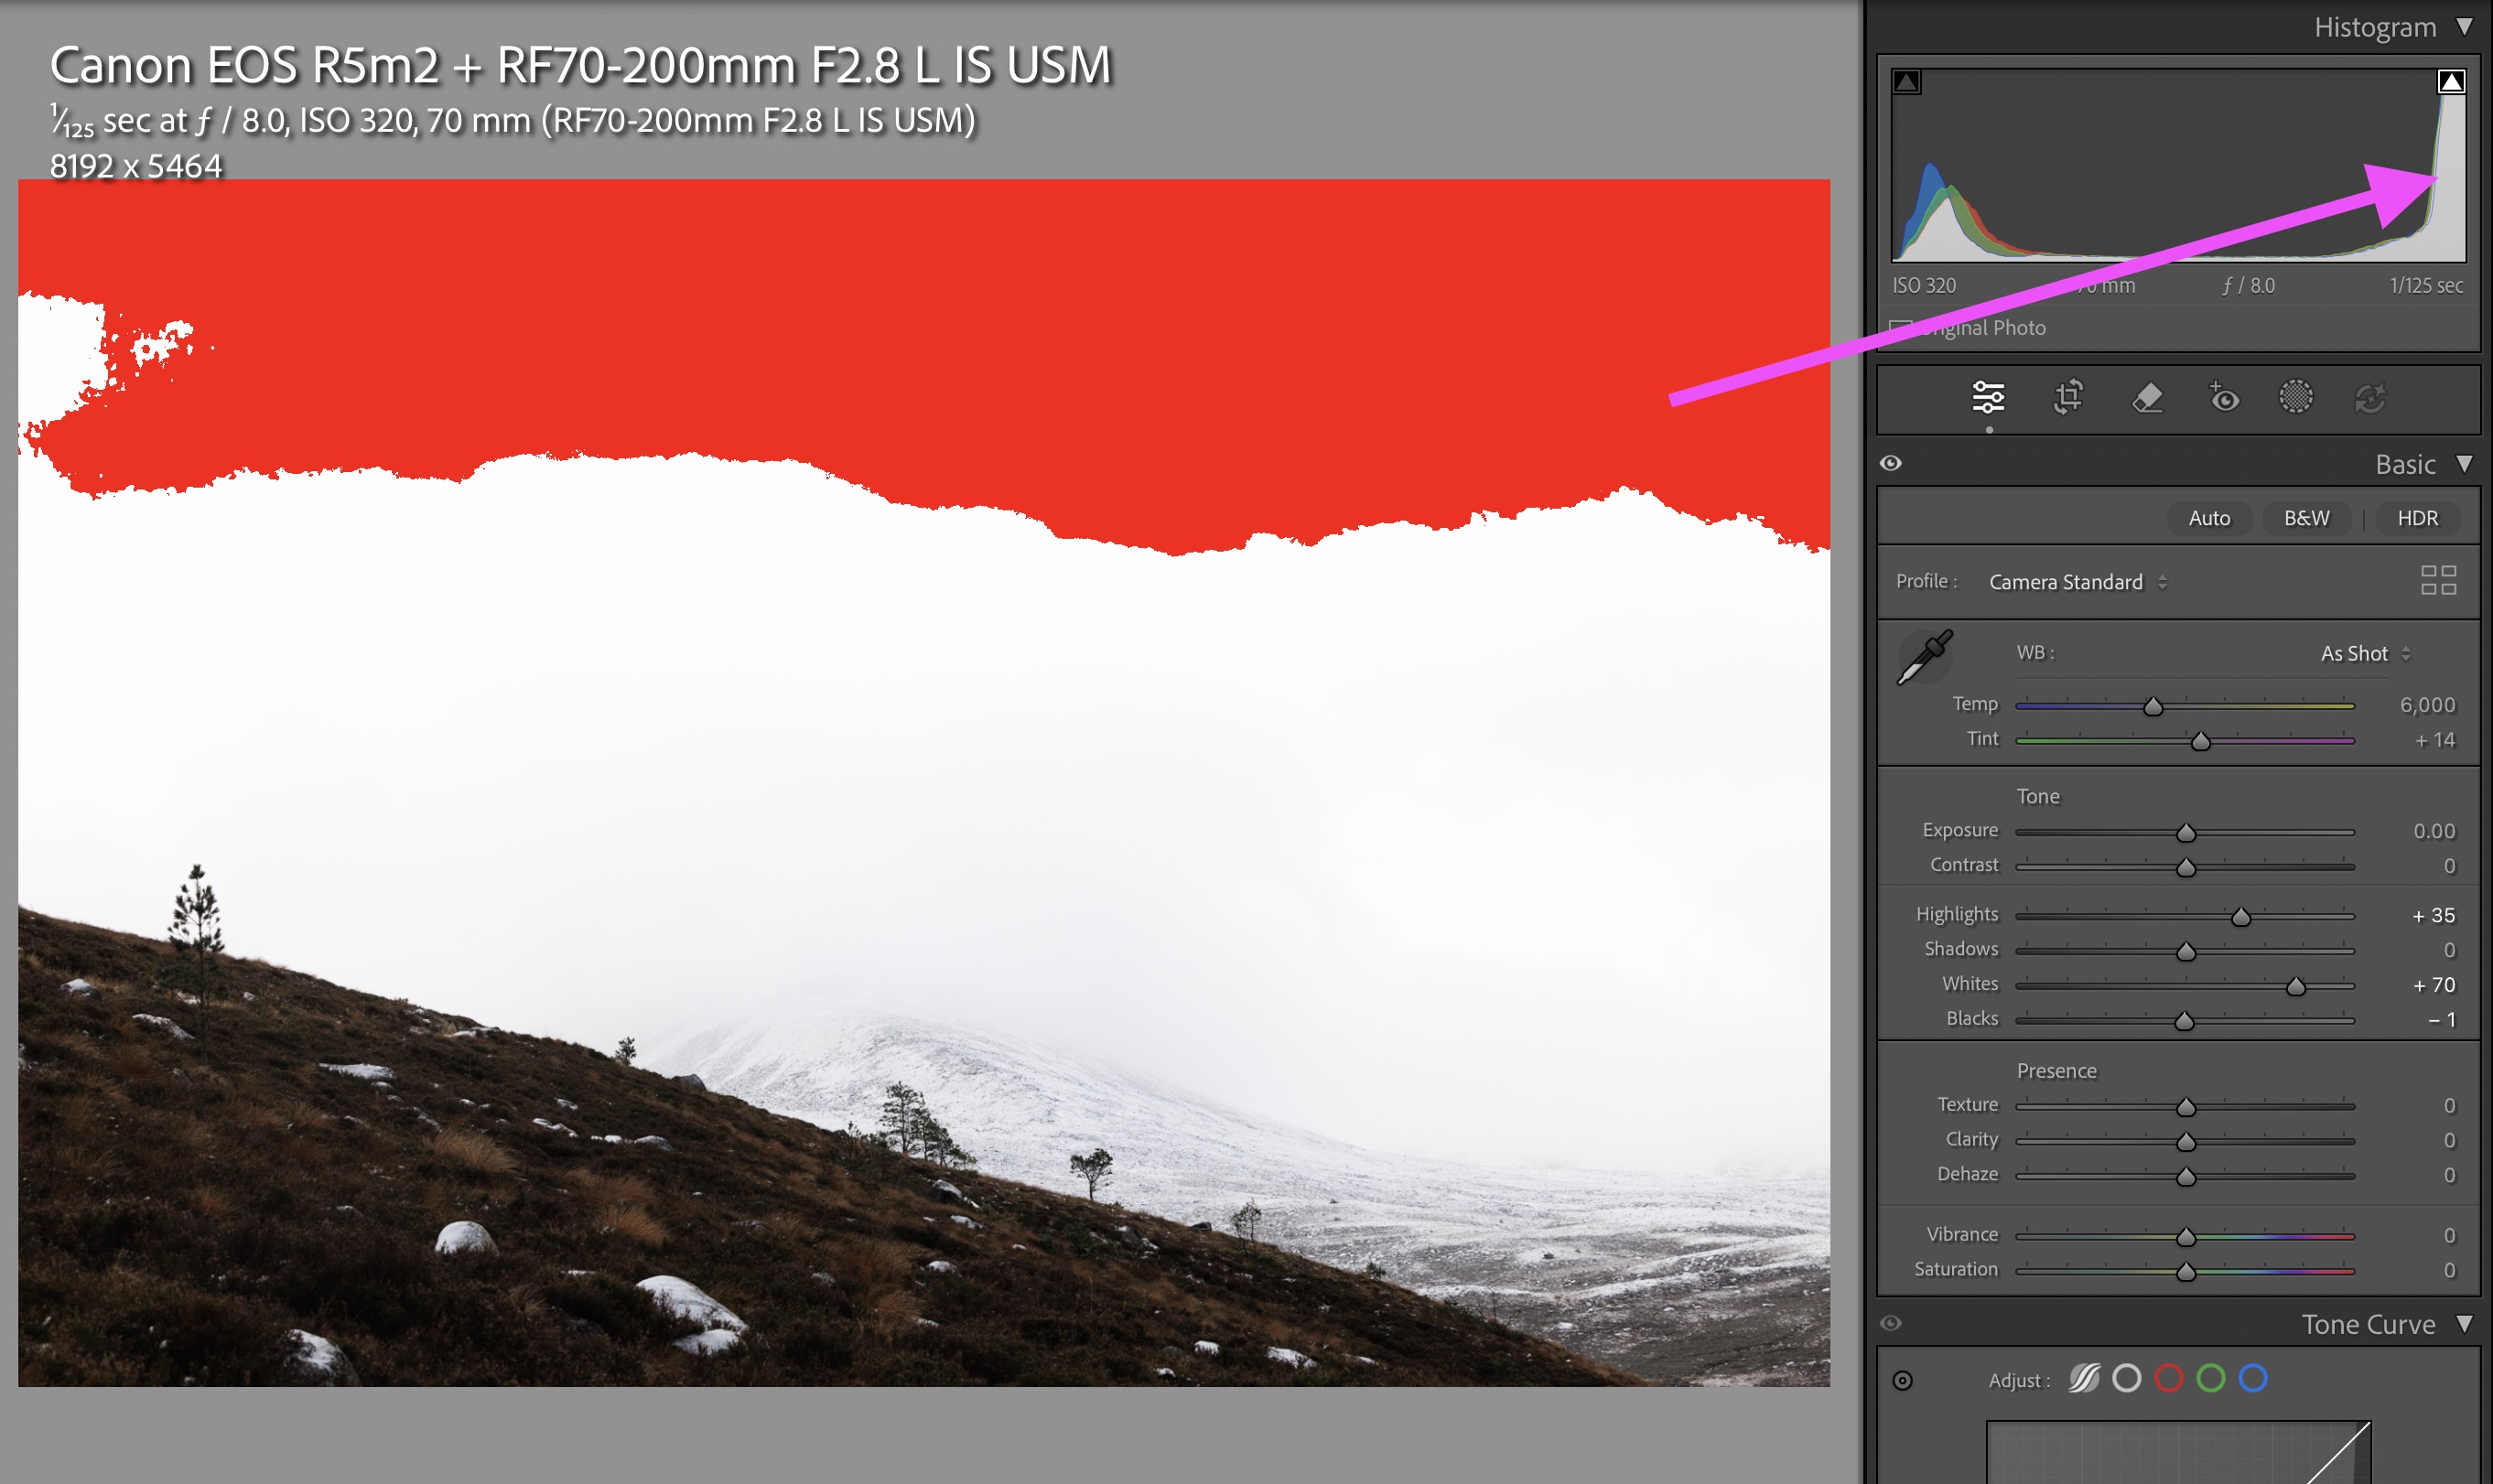
Lightroom can show you where exactly in the image is clipping, as seen here
Technical note: Highlight clipping is an absolute limit. Once a pixel hits pure white, your data’s gone for good. Shadow ‘clipping’ works a little differently; the information isn’t wiped to zero, it simply becomes buried in sensor noise. That’s why very dark, underexposed areas often turn out grainy when you brighten them during editing.
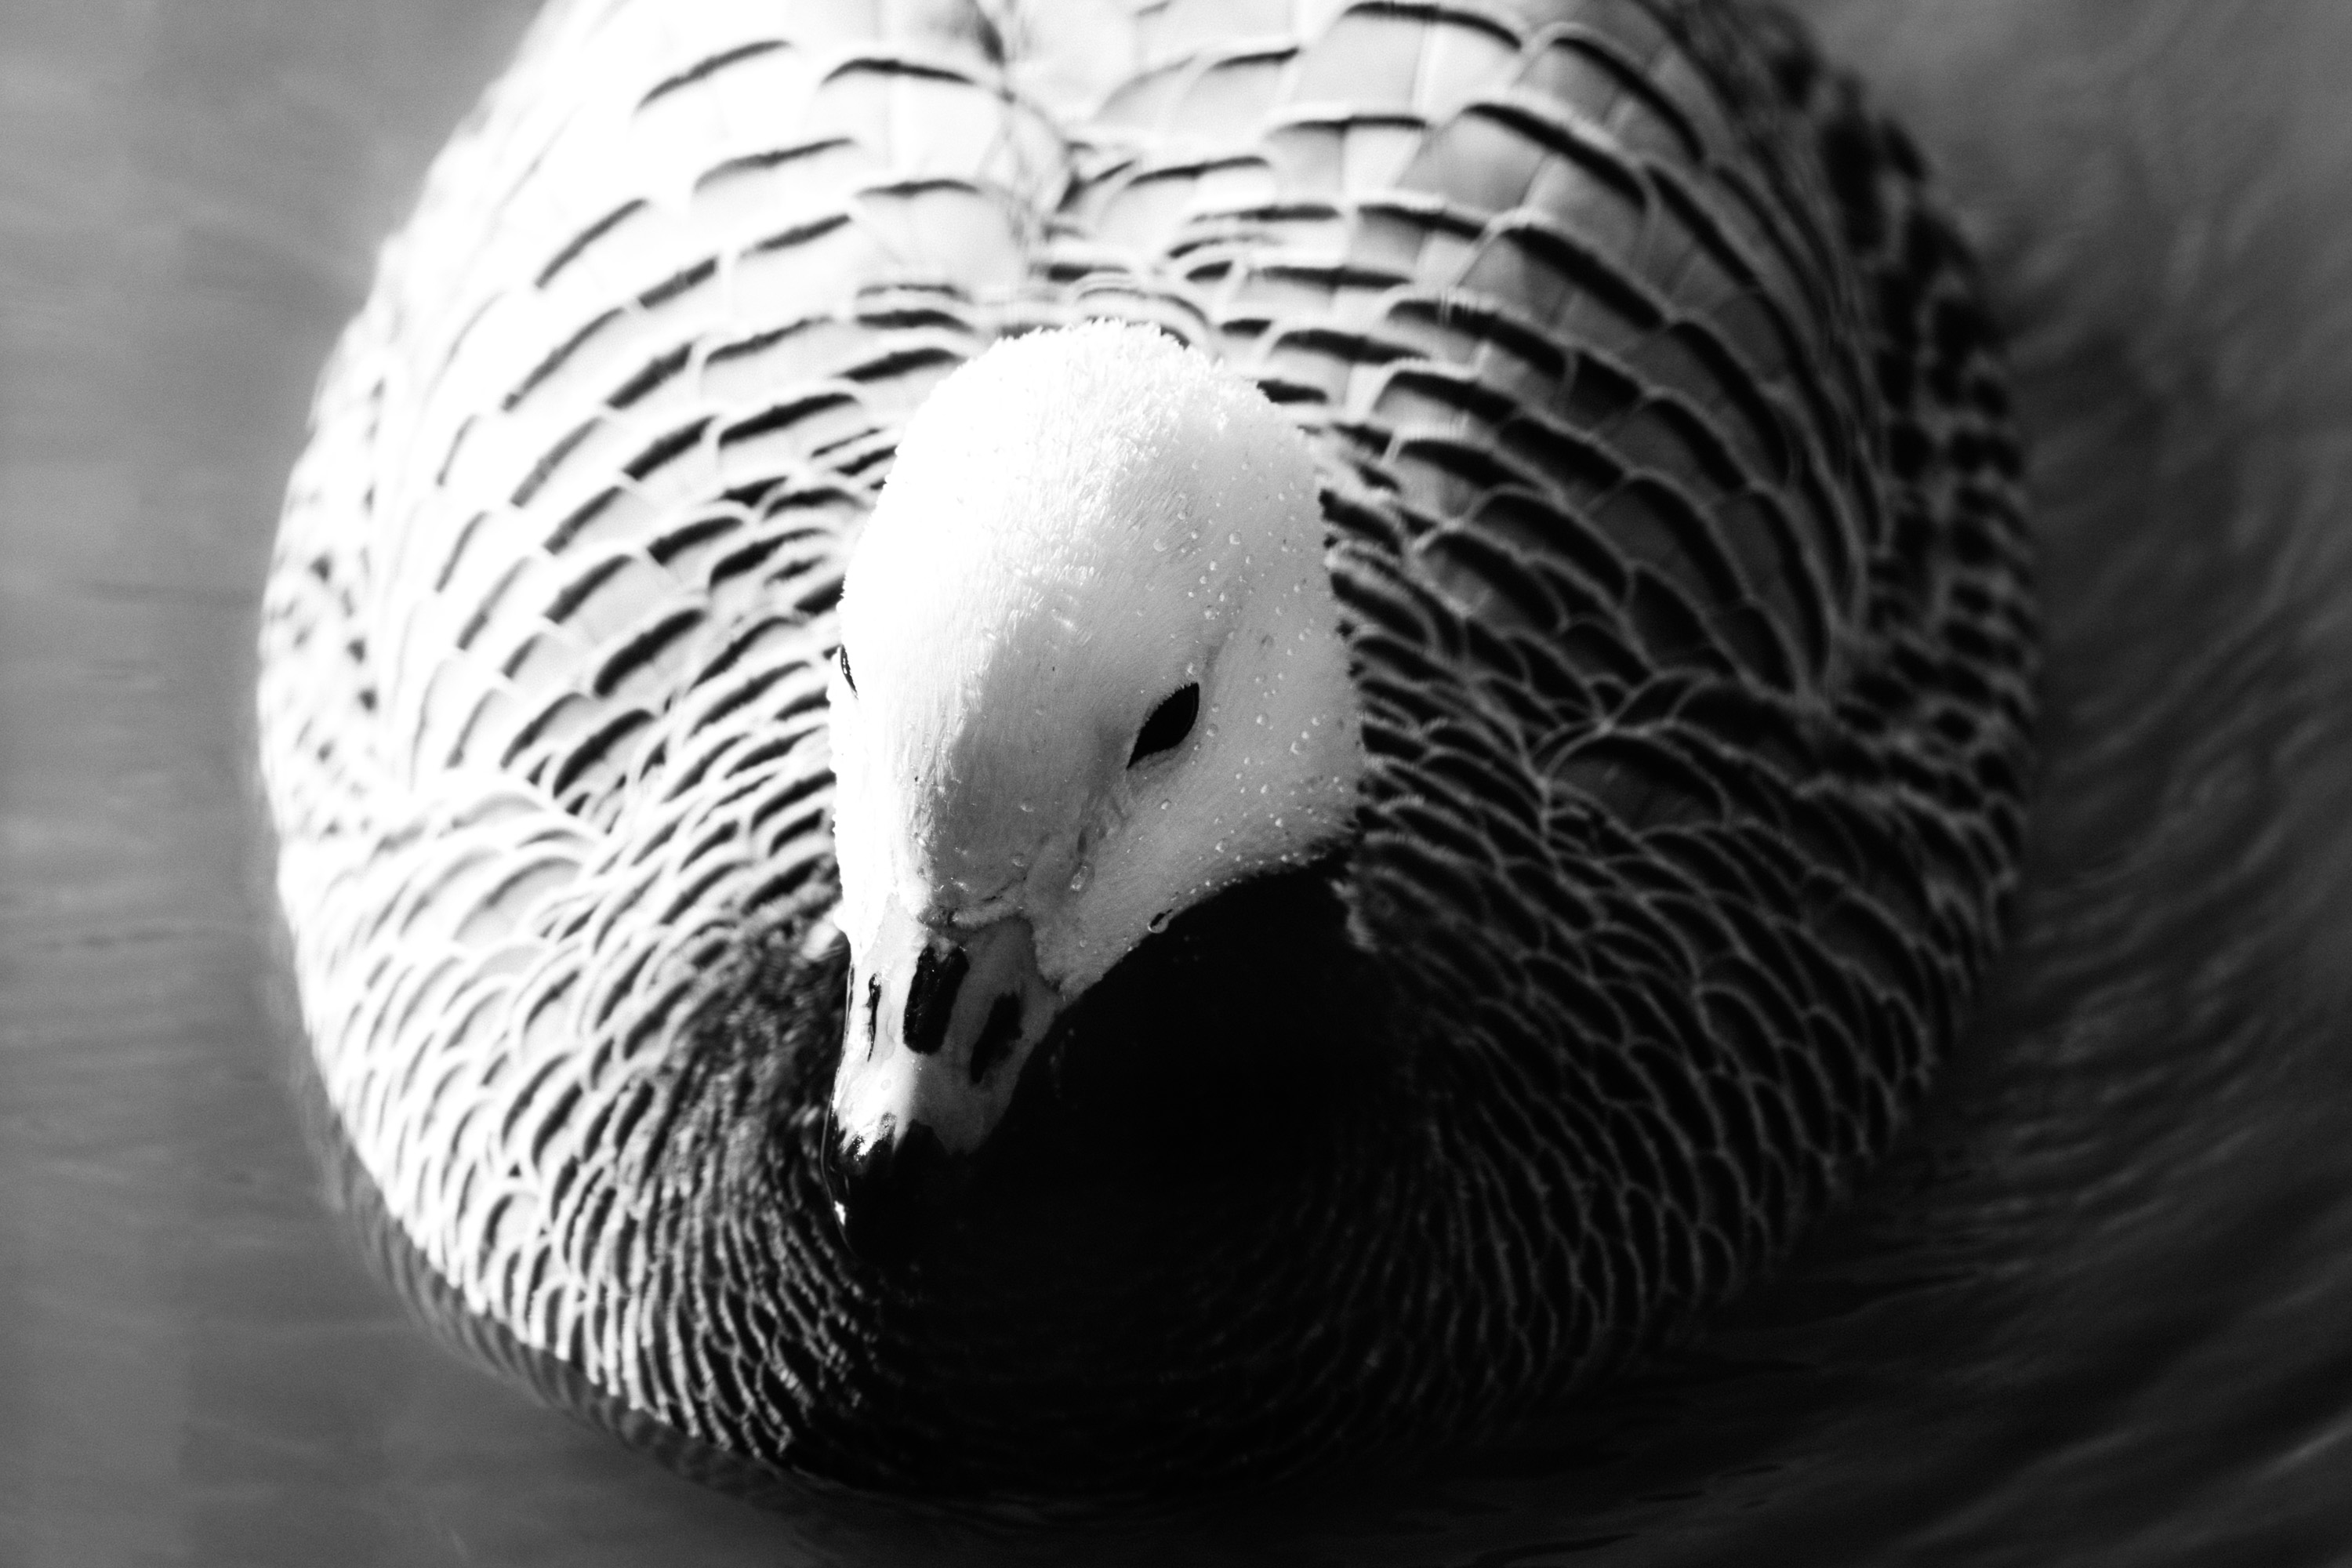
Connor Redmond | Nikon Z8 | Nikon Nikkor Z 100-400mm f/4.5-5.6 VR S | 400mm | f/10 | 1/1000 sec | ISO 1250
Does a histogram have to look like a mountain?
You might often hear that an ‘ideal’ histogram should look like a neat little mountain peaking in the middle. In practice, this isn’t a rule at all. It’s what you expect to see from a fairly average, evenly lit, well-exposed scene.
The way the histogram looks depends on your subject matter. There is no ‘right’ histogram. Photograph a plain white wall and you’ll see one enormous spike on the right. Photograph a dark forest scene with bright sunlight poking through and you will get a banana-like curve. Both are fine; what matters is you’re capturing as much information as you can while avoiding clipping or underexposing.
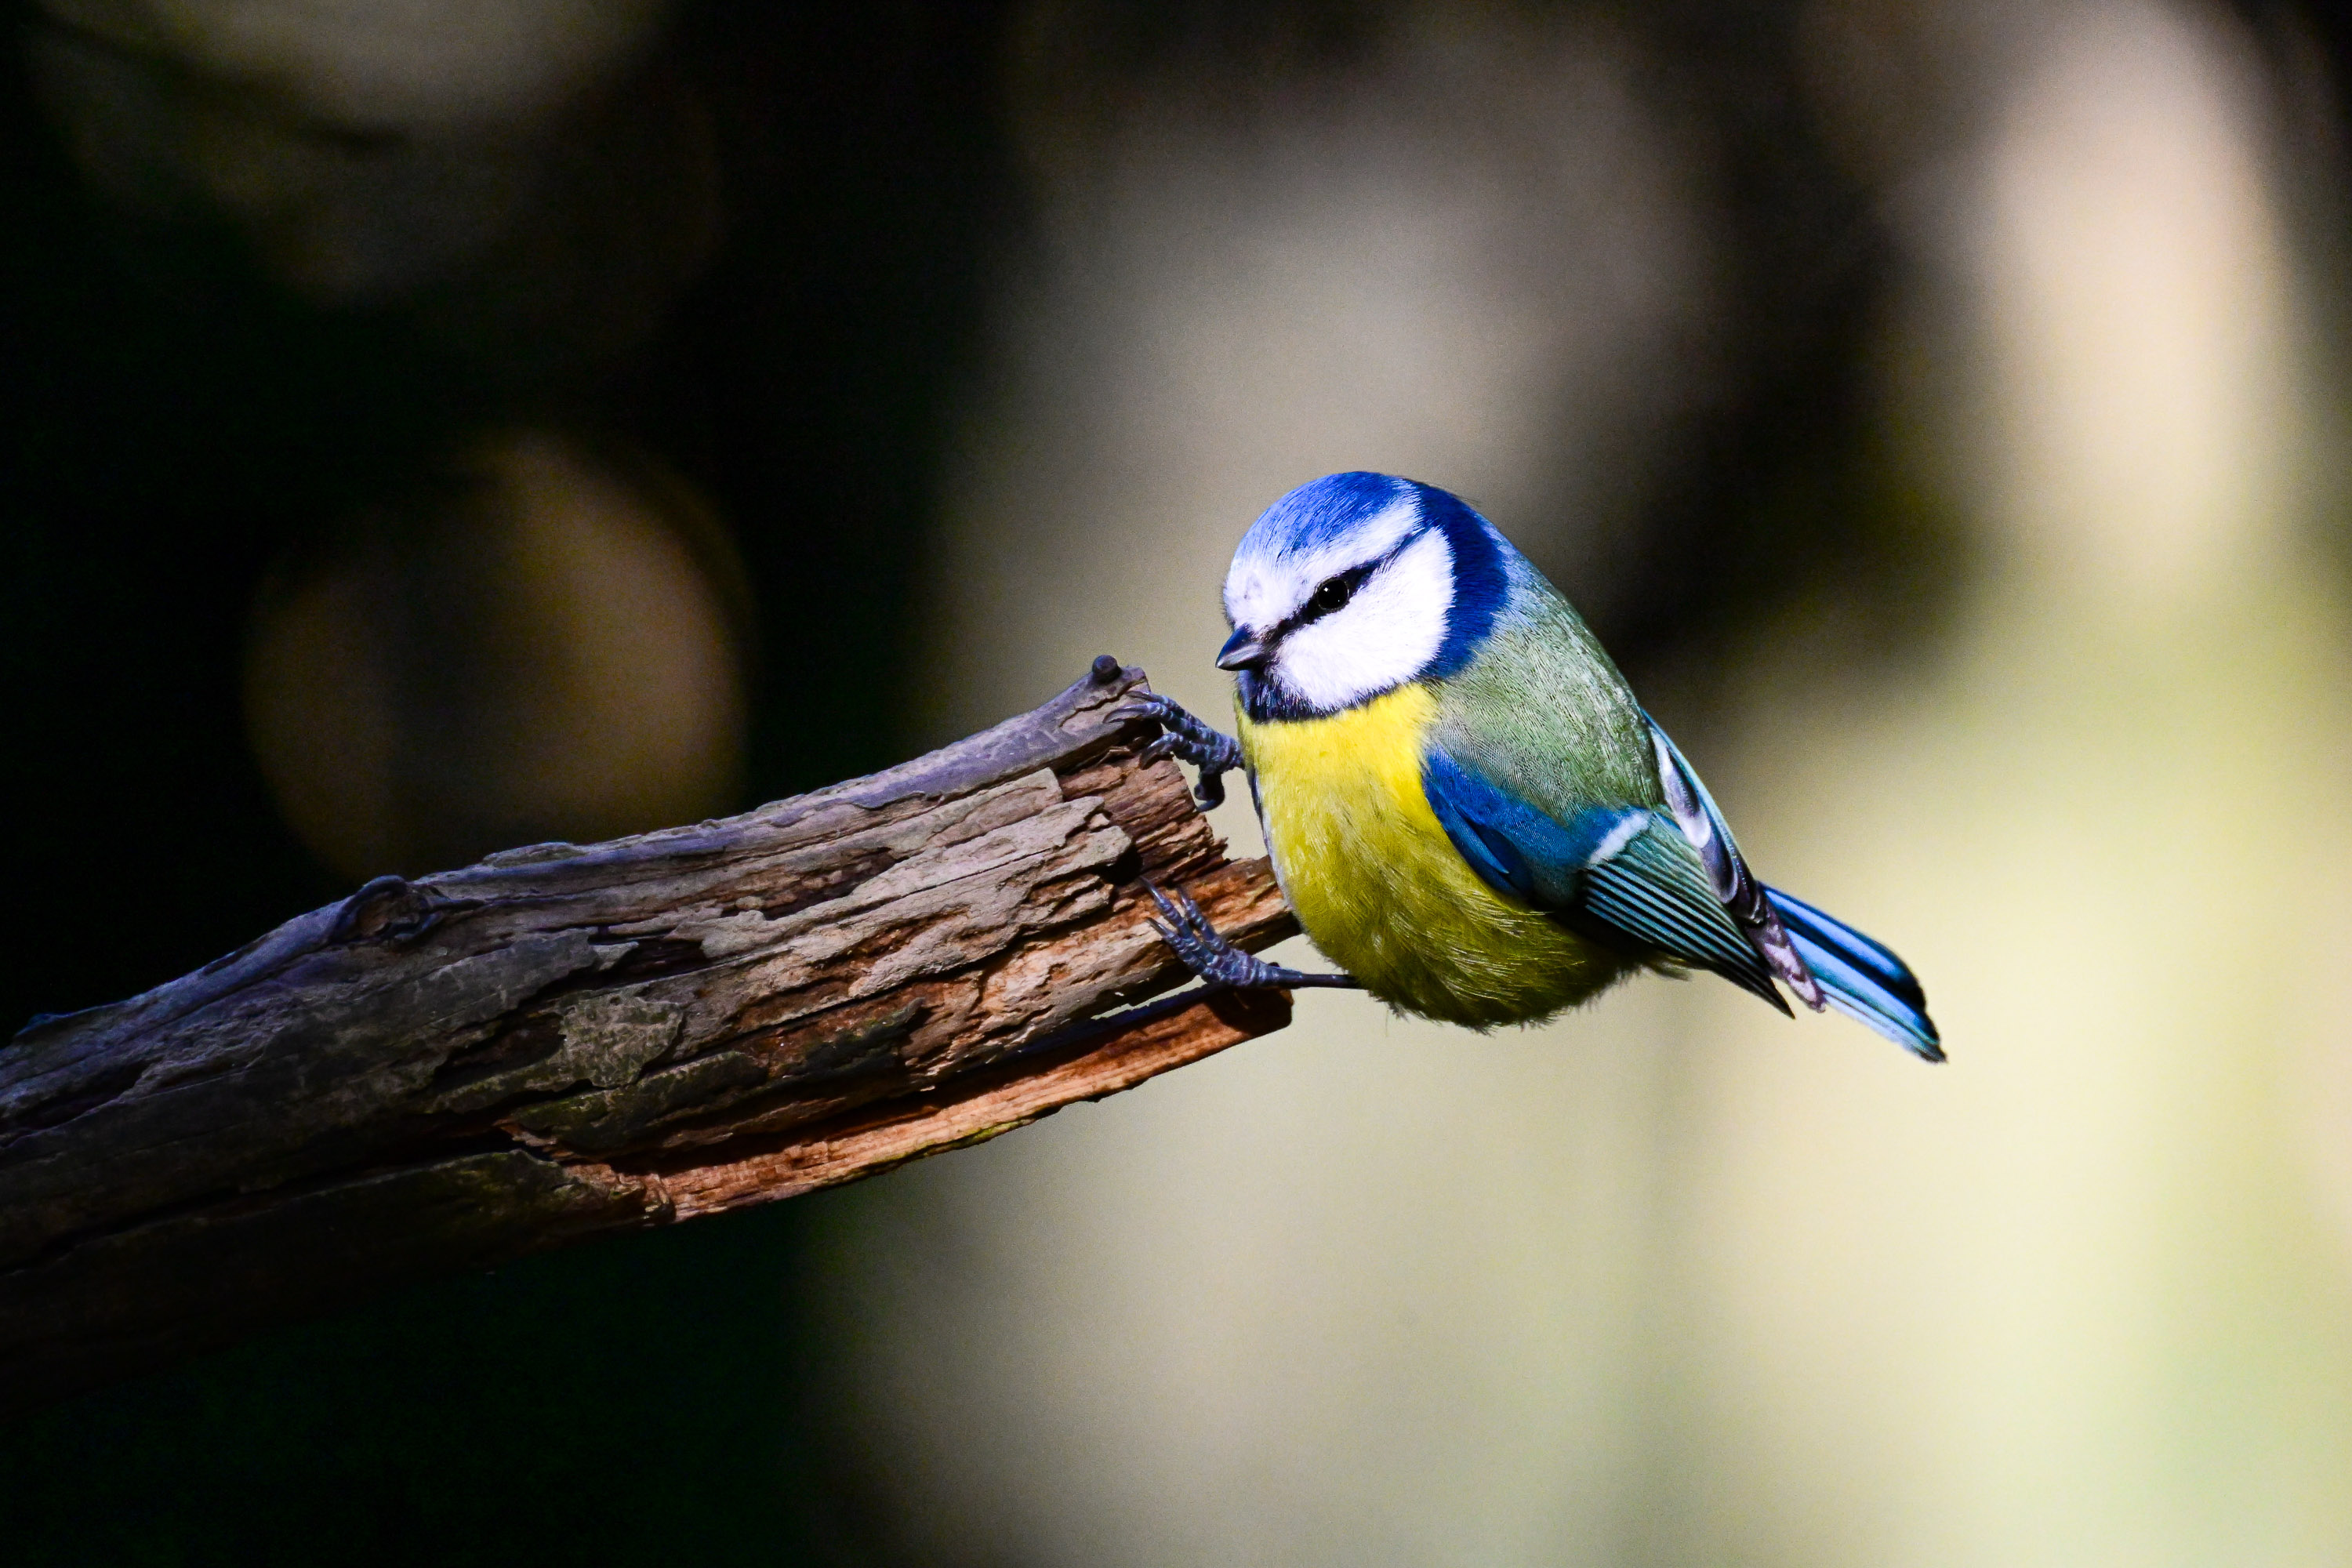
Connor Redmond | Nikon Z8 | Nikon Z 100-400mm f/4.5-5.6 VR S | TC-2.0x | 800mm | f/11 | 1/1000 sec | ISO 5600
Why you should expose to the right (ETTR)
Many photographers use the ‘Expose to the right’ (ETTR) exposure technique, which refers to the right of the histogram towards the highlights. The idea here is to give the sensor as much light as possible without overexposing. This works because the more light you capture, the less noise you’ll end up with, which in turn means more detail. It also leads to greater tonal range and richer colours.
Author note: It’s worth being clear that this is a technical decision about exposure, which is not the same thing as deciding how bright you want the final image to look. Those are two separate things: what a light meter suggests and the exposure you decide to choose don’t always have to match. Exposing to the right is a deliberate choice you make to protect image quality (Remember: you can always bring the brightness back down when editing afterwards).
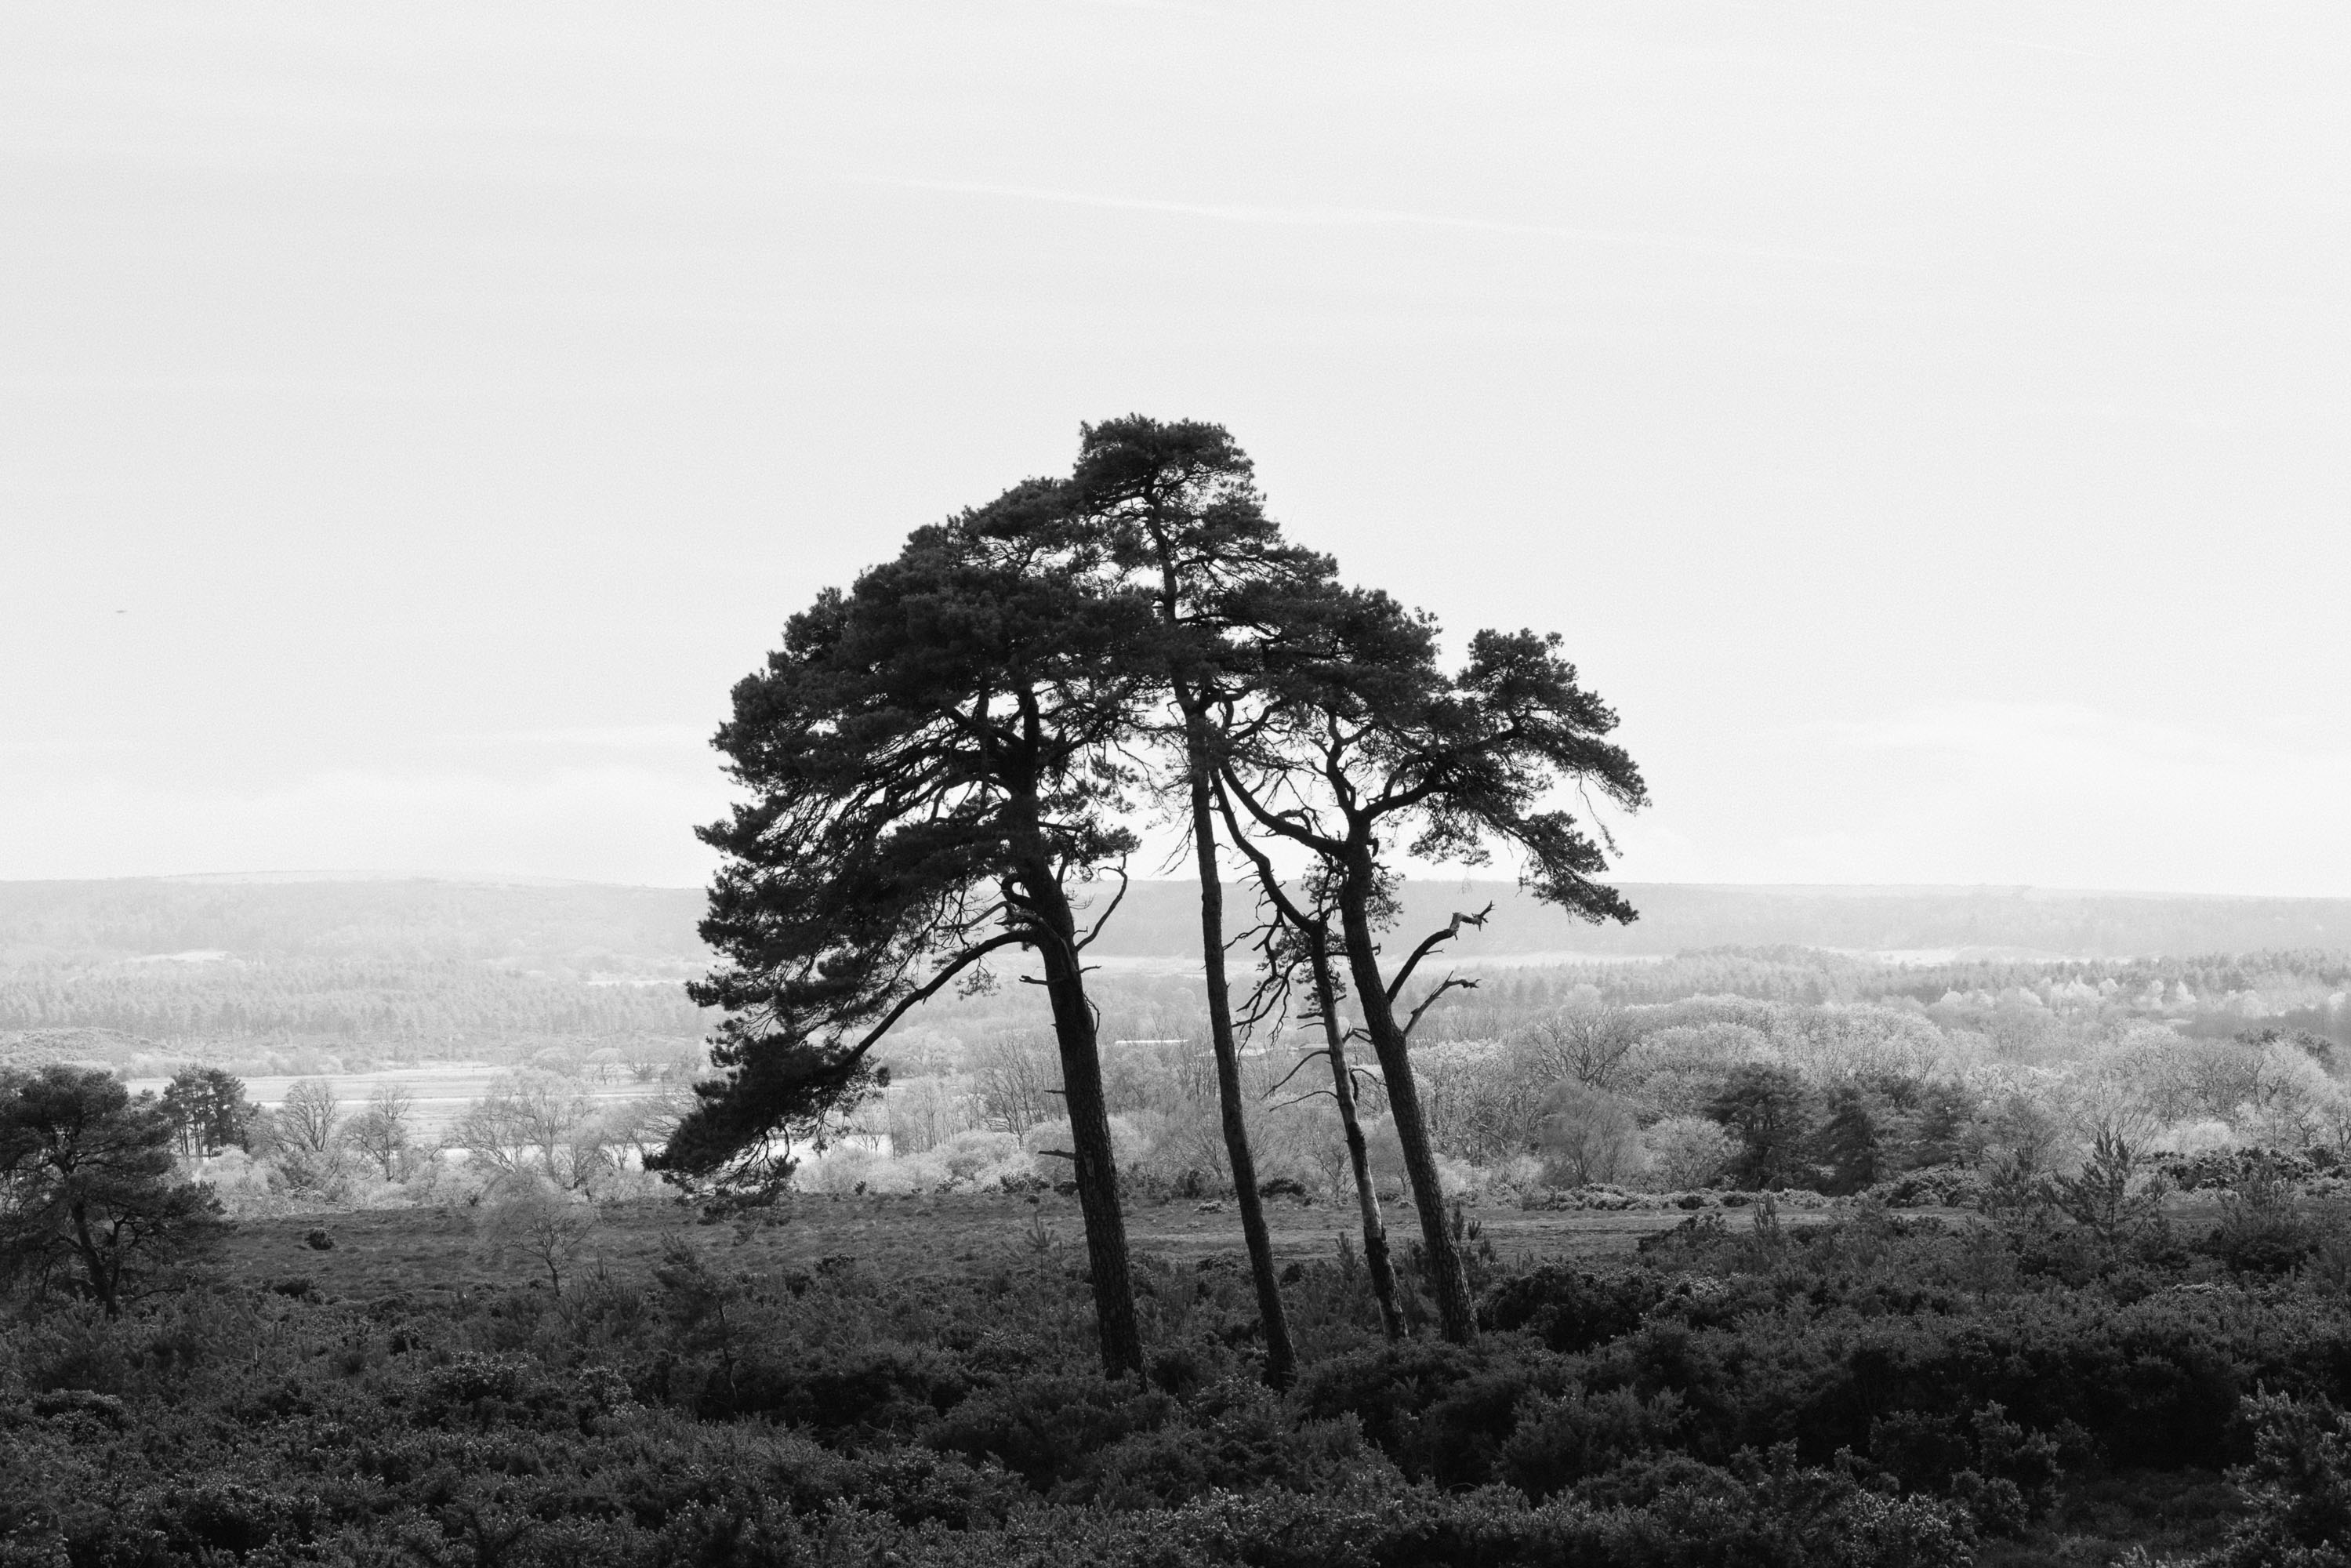
Connor Redmond | Canon EOS R5 Mark II | Canon RF 85mm f/1.2 L USM DS | f/9.0 | 1/160 sec | ISO 100
The big caveat
For the vast majority of cameras, the histogram shown on the back screen will use the JPEG preview for its information and not your actual RAW data. This is a problem, because JPEGs are what are called “8-bit files”, which contain considerably less information than RAW, making the histogram less reliable. See the difference between 10-bit and 8-bit in our 8-bit vs. 10-bit videography article.
This sometimes means your camera’s histogram can tell you a photo is clipped when the RAW file actually isn’t. It also means that other in-camera settings such as white balance, contrast, saturation and your chosen picture profile can change the shape of the histogram you see, even though none of the settings affect the actual RAW file.
A handy trick to get around this is to set your in-camera picture profile to the lowest contrast setting. This makes the JPEG preview less intense and brings the histogram closer to what your RAW file can handle. For more context, check out our guide to image file formats.
Using the histogram to adjust your camera settings
Once you understand what you’re looking at, make sure you put it into practice. Keep the exposure triangle in mind and adjust your ISO, shutter speed or aperture to keep the graph within the edges. Want a reminder of how the exposure triangle works? Find it in our exposure triangle guide. Remember, this is a guide not so much a hard and fast rule. But I’d advise you to stick to this if you want to get the best exposure. Even better advice is to use ETTR and keep the graph more towards the right. You can thank me later.
FAQs
Do I need to check the histogram for every shot?
You don’t need to check the histogram every time you take a photograph, especially if you are shooting fast-moving subjects. For slower-paced subject matter, it can help a lot when exposing.
What’s the difference between an RGB histogram and a luminance histogram?
The difference between an RGB histogram and a luminance histogram is the information they display. A luminance histogram shows the overall brightness, while an RGB histogram splits the three colours, red, green and blue into separate channels, which helps you catch clipping in a single colour channel. Lightroom will combine all of these into one.
Does a histogram matter in black-and-white photography?
The luminance histogram becomes your main reference for monochromatic images, since the individual colour channels are no longer relevant.
Can I use a histogram when shooting video?
You can use a histogram when you’re shooting video. Many cameras will display a live histogram in video mode, but video cameras have other ways of monitoring exposure live as well, like zebras and false colour.
Is the histogram in Lightroom more accurate than the one on my camera?
Lightroom's editing software is much more accurate than the one on your camera. This is because it reads the histogram directly from the RAW file, rather than from the JPEG preview your camera uses.
What’s the difference between a histogram and zebra warnings?
The difference between zebra warnings and histograms is how they show exposure information. Zebras highlight specific areas of the frame that are close to clipping as you shoot, whereas the histogram shows the tonal spread of the whole image all at once.
Read more tips and techniques on the MPB content hub.
You can sell or trade your camera kit to MPB. Get a free instant quote, free insured shipping to MPB, and get paid within days.